
Corrugated Plant Analytics: KPIs That Reveal Waste, Downtime, and Speed Losses
A corrugator can appear productive while quietly losing material, time, and usable capacity. A high daily output figure does not show whether trim is rising, whether starch is being over-applied to compensate for weak bonding, or whether the machine is repeatedly slowing below its planned rate. Corrugated plant analytics becomes useful when production data is tied to the conditions under which board was made: paper grade, flute profile, order length, moisture condition, splice activity, web breaks, and quality disposition.
The most useful KPIs are not isolated dashboard numbers. They are linked signals. A drop in speed accompanied by stable scrap may point to an intentional quality-protection response. The same speed drop combined with growing trim, warp complaints, and frequent stops points toward a process instability. Reading those relationships prevents a normal product mix change from being misclassified as a machine-performance problem.
Start with a common production basis
Before comparing shifts, products, or runs, define the measurement basis. Planned production time should exclude scheduled shutdowns that are formally outside the run plan, while unplanned downtime should include stoppages that interrupt available production time. Good board should mean material accepted for the next process, not simply board that passed the cutoff knife. If downgraded or reworked board is counted as good output, yield can look healthy while the converting department absorbs the loss later.
Order mix also matters. Narrow widths, short runs, heavy doublewall grades, frequent flute changes, and difficult recycled papers do not behave like long runs of standard singlewall board. A useful report therefore keeps a plant-wide view but allows comparison within similar grade families, widths, and process routes. Otherwise, a shift handling more changeovers may look slower even when execution is disciplined.
Waste KPIs that identify where fiber is being lost
Trim waste is often the first material-loss KPI to review. It is the difference between incoming paper width and the usable board width, plus losses created by setup, edge defects, and rejected sections. Its percentage should be read alongside order width and scheduling pattern. A higher trim ratio on a narrow order may be unavoidable on a fixed-width paper supply. A sudden increase on a repeat order deserves investigation: incorrect web alignment, poor reel preparation, excessive edge trimming, or a changed paper-width selection can all produce the same number.
Separate trim into planned and unplanned components. Planned trim comes from the designed width relationship. Unplanned trim includes damaged edges, excessive side trim after web wandering, and board removed while restoring conditions after a splice or break. Combining them masks the distinction between scheduling loss and controllable process loss.
Startup and changeover waste reveals whether the line reaches stable production quickly. Measure the board discarded from the first paper feed through the point at which bond, moisture, cut length, and board profile are accepted. A short changeover with high startup scrap is not necessarily better than a slightly longer changeover that produces stable board promptly. The metric needs both time and material: minutes to stable output, meters discarded, and the reason code behind the delay.
Starch consumption per unit of good board can expose a developing issue, but only after adjusting for board construction. A heavier grade or different flute geometry needs a different adhesive application than a light singlewall sheet. Within the same product family, rising starch use may indicate excessive glue gap, poor viscosity control, inaccurate metering, or attempts to cover up insufficient heat transfer. More starch does not automatically create a stronger bond. Excess adhesive adds water, increases drying demand, and can contribute to warp or wet board at the dry end.
Track starch use with liner and medium moisture, steam condition, and bond-test results. If adhesive use climbs while bond failures persist, the cause is likely upstream of the glue quantity itself. A contaminated applicator roll, poor paper preconditioning, inadequate gelatinization, or pressure settings at the bonding section can be more relevant than the starch recipe.
- Paper break waste should include the damaged web, the board rejected while the line is restarted, and any material lost during rethreading. Counting only the break event understates its cost.
- Off-spec board waste needs defect categories such as delamination, blistering, crushed flute, warp, poor caliper, and cut-length error. A single “quality scrap” code cannot reveal the responsible station.
- Rework or downgrade volume should remain visible even when it does not become immediate scrap. Material that cannot run through printing, die-cutting, or folding at normal settings has lost value and capacity.
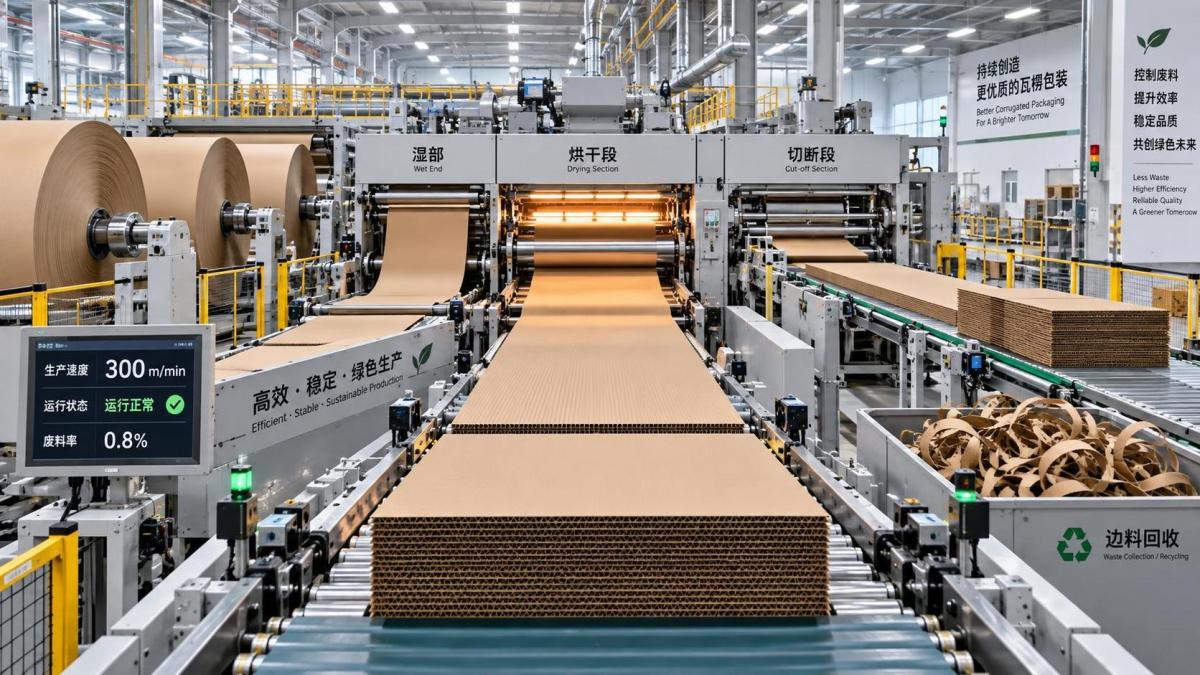
Downtime needs location, duration, and recovery context
Unplanned downtime is often reported as total stopped minutes. That is a starting point, not a diagnosis. The same total can arise from one long mechanical failure or dozens of short interruptions. These require different corrective actions. A failed drive or bearing may need maintenance planning and spares review. Recurrent short stops around the cutoff, stacker, or transfer points can indicate sensor contamination, timing drift, unstable board geometry, or downstream congestion.
Record three timestamps where the control system permits it: stop detected, fault cleared, and stable production restored. The difference between fault cleared and stable output is frequently overlooked. A machine can be running while making unusable board, operating at a reduced rate, or waiting for downstream flow to normalize. Recovery time often exposes the practical burden of a fault more accurately than the alarm duration alone.
Reason codes must be usable on the floor. Overly broad codes, such as “machine issue” or “quality,” create clean-looking but unhelpful reports. Overly detailed lists encourage default selections and inconsistent use. A short hierarchical structure works well: station or system first, then event type, then an optional comment for unusual conditions. Periodically compare operator-entered reasons with alarm logs and maintenance records. Disagreement may reveal a training gap, but it can also show that the equipment alarm does not describe the production consequence.
Planned downtime should not disappear from analysis. Blade changes, scheduled cleaning, warm-up, and approved maintenance are legitimate activities, yet their duration and frequency affect available capacity. Treating every planned stop as irrelevant can hide a maintenance routine that has gradually become longer or more frequent.
Speed loss is not simply the difference from nameplate speed
Line speed should be compared with an attainable reference for the actual order, not the highest speed ever reached by the corrugator. The reference should reflect flute type, basis weights, board construction, required cut length, print or converting constraints, and any approved quality limits. A doublewall order with heavy liners has a different thermal and mechanical response from a light E-flute order. Applying one standard speed to both produces a misleading loss calculation.
A practical speed-loss KPI measures the gap between planned attainable speed and the time-weighted actual speed while the line is producing. Exclude true stops from this calculation so that speed loss and downtime remain separate. Then examine the profile, not just the average. A line that holds a steady reduced speed may have a known material or quality constraint. A line that oscillates between acceleration and deceleration often has unstable moisture, weak bond development, recurrent jams, or poor coordination with the dry end.
Speed losses at the wet end often show up before they become formal downtime. The line may be slowed because the medium is entering too dry or too wet, because paper tension fluctuates, or because heat transfer cannot stabilize the adhesive quickly enough. At the dry end, speed can be restricted by warp, uneven traction, cut accuracy, stack formation, or a bottleneck in board removal. The same low speed therefore needs a station-level attribution rather than a generic “slow running” label.
Use speed and quality together
Speed should not be recovered by ignoring board condition. Monitor bond strength, moisture, caliper, flute formation, warp, and cut accuracy against the actual production speed. A useful pattern is to plot quality failures around speed changes. If delamination appears after acceleration, the relevant issue may be heat, adhesive cure, pressure, or paper moisture. If warp rises during long periods at a lower speed, excess dwell time and moisture imbalance may be involved. The corrective action is different even though both events are associated with speed.
Board moisture deserves special attention because it connects material condition, steam use, adhesive behavior, and warp. An average moisture value can be acceptable while cross-machine variation causes trouble. One edge may run drier because of paper profile, preheater contact, or heat distribution, producing curl or uneven bonding. Where measurement is available, pair cross-direction moisture readings with warp direction and the location of trim or quality rejects.
From KPI review to a repeatable response
Review trends at several time scales. Shift-level views catch immediate disturbances. Weekly views reveal repeat patterns by paper supplier, grade, machine section, or maintenance interval. A monthly aggregate is useful for capacity planning, but it can dilute short recurring faults into an apparently minor percentage.
When a metric deteriorates, confirm the data before changing a recipe or mechanical setting. Check whether the order definition was correct, whether downtime overlaps were removed, and whether scrap was entered at the right station. Then compare the affected runs with a stable reference run of similar construction. The comparison should include actual speed, stop sequence, paper reels, steam and adhesive conditions, quality records, and maintenance activity. This narrows the search from a broad production problem to a condition that can be tested.
After an adjustment, retain the before-and-after evidence rather than closing the issue when the next run looks normal. A stable result across repeated comparable orders is stronger than a single good shift. Corrugated plant analytics is most valuable when it creates that discipline: material loss is traceable to a process condition, downtime includes recovery, and speed is judged against board quality rather than output alone.
Related News
Get weekly intelligence in your inbox.
No noise. No sponsored content. Pure intelligence.
